Compare Plan Values to Actuals
Measure the progress of your plan by comparing plan values to actual data.
You can create a metric comparison in the Explore room to see how your plan is performing against actual data. Comparing plan values to actuals will help you decide whether or not you need to revise your plan.
Create a metric comparison between plan values and actuals
Create a metric comparison from the planning grid
To illustrate this workflow, let's say you want to compare the plan Headcount to the actual Headcount for Research and Development (R&D) in January 2019.
- Select the plan metric you want to compare by doing one of the following:;
Planning gird view Do this Segments view - Select the plan metric you want to compare in the Context picker. In this example, you would select Headcount.
- Select the segment for the time period you want to compare by selecting the corresponding cell in the planning grid. In this example, you would select the plan value for R&D in January 2019.
Plan Items view - Select the segment you want to compare in the Context picker. In this example, you would select R&D.
- Select the metric for the time period you want to compare by selecting the corresponding cell in the planning grid. In this example, you would select the Headcount value for January 2019.
Note:
- Selecting a single cell will create a metric comparison for the selected time period in a Breakdown visual.
- You can also compare data over time in a Trend visual by selecting multiple cells (time periods).
- Add the comparison to the Explore room by doing one of the following:
- Click the Explore button
 in the toolbar.
 - Right-click and click Explore in the In-context menu.
Result: The comparison opens in the Explore room.
- Click the Explore button
Create a metric comparison in the Explore room
To illustrate this workflow, let's say you want to compare the plan Headcount to the actual Headcount for Research and Development in January 2019. The name of your plan is Workforce Plan.
Note:
- The available attributes that you can group your metric comparison by is determined by the dimensions you included in your plan.
- Set the time context by clicking the Time picker in the Analysis Context toolbar. In this example, you would set the time context to January 2019. For more information, see Change the Time Context.
- Select the plan metric. In this example, you would select the plan Headcount metric for the scenario you want to compare . For more information, see Select a plan metric.
- Click the Compare to button
 on the Visual Actions menu.
 - In the Compare to panel, click Metric, and select the actuals metric you want to compare. In this example, you would select the Headcount metric.
For more information, see Create a Metric Comparison.
Select a plan metric
- With the metric picker in full screen, select the name of the Planning model in the Categories pane.
- In the Metrics pane, click Add metric option for the plan metric you want to analyze.
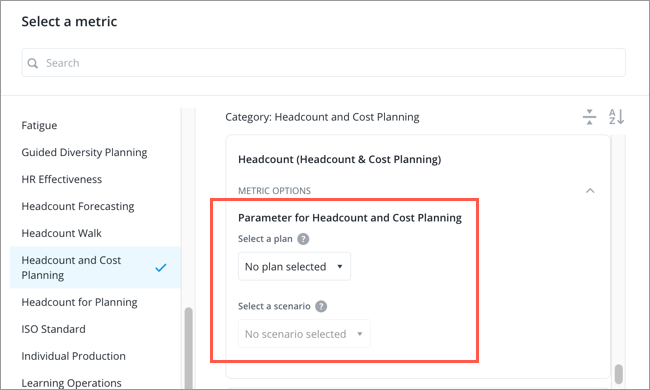
- Under Metric Options select:
- The plan name.
- The plan scenario.

- Click Apply.
How the comparison order affects actuals
By default, the dimension structure that is used to calculate the actuals metric will depend on the order of the metrics in your comparison.
If the plan metric is set as the primary metric, where the comparison is Plan Metric vs Actuals Metric, the actuals metric will be calculated based on how the dimension is structured at the time of the plan's baseline period.
If the actuals metric is set as the primary metric, where the comparison is Actuals Metric vs Plan Metric, the actuals metric will be calculated based on how the dimension is structured in the selected time period.
As a result, if your organization restructures, and you have yet to update your plan baseline, you may see a discrepancy in the actuals metric when you change the order of the metrics in your comparison. In addition, when you change the order of the comparison metrics, you may also see a different set of dimension members in your visual because of the changes to the dimension structure. As a result, you may notice a discrepancy between the overall value shown in the Info panel and the sum of the visual items displayed.
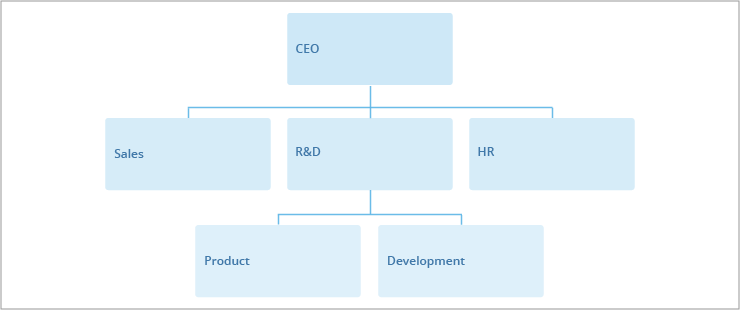
To illustrate this concept, let's say in June of 2018, your organization had the following structure, where Research and Development (R&D) consisted of Product and Development:

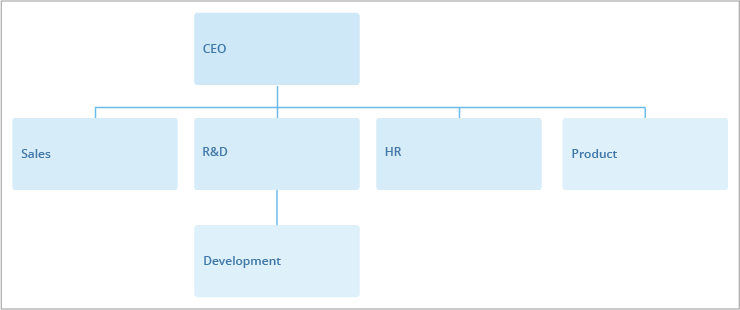
In November of 2018, there was a minor re-organization where Product is moved out of R&D and placed directly under the CEO:

In January of 2019, you want to see how your plan is progressing, so you create a comparison between plan values and actuals data. You compare the two metrics in a Breakdown visual grouped by Organization Hierarchy. Let's assume:
- The plan baseline period is set to June 2018
- The actual headcount for Product in January 2019 is 20
- The actual headcount for Development in January 2019 is 80
Depending on the order of the metrics in the comparison, you will see different Headcount values for R&D:
- Comparison A: Plan Metric vs Actuals Metric. In this example, Plan Headcount vs Headcount, the Headcount for R&D is 100
- Comparison: B: Actuals Metric vs Plan Metric. In this example, Headcount vs Plan Headcount, the Headcount for R&D is 80
In Comparison A, the plan metric is the primary metric in the comparison, so the organization structure that is used to calculate the actuals metric is determined by the plan's baseline period. The plan's baseline period is June 2018 and at that time Product was still a part of R&D, so Product is included when calculating the Headcount for R&D.
In Comparison B, the actuals metric is the primary metric in the comparison, so the organization structure that is used to calculate the actuals metric is determined by the selected time period. The comparison is for January 2019 and at this point Product is no longer a part of R&D, so Product is not included when calculating the Headcount for R&D.
Note: When comparing plan values against actuals data, we recommend that you use the plan structure for the actuals calculation. This will allow you to compare the same population of employees that has been defined within the plan to those in actuals. Since plans are future looking, there may be changes to the organization that is being modeled, such as expansions, eliminations, and consolidations. In order to get an accurate comparison that accounts for the changes in the organization structure, as defined in the plan, the actuals values should also be calculated using the same organization structure. Without a common and shared organizational hierarchy, the plan values will represent one population of employees and the actuals will represent another, making the difference between the values hard to identify and understand.
Change the dimension structure used in comparisons
When comparing plan and actuals metrics, you can change the dimension structure that is used to calculate the actuals metric without having to change the order of metrics in the comparison.
To change the dimension structure used to calculate actuals:
-
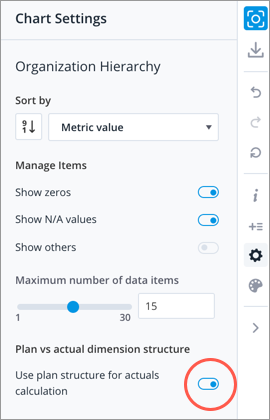
Click the Settings button
 on the Visual Actions menu.
 - In the Chart Settings panel, under Plan vs actual dimension structure, click the Use plan structure for actuals calculation toggle to set the dimension structure you want to use in the comparison.

